
The investment world buzzes with a new caution: the S&P 500 has flashed a significant warning signal. Recent market behavior suggests potential downside ahead. Understanding this signal is crucial for investors. This guide offers expert insights and actionable steps. Learn how to safeguard your portfolio from potential market volatility.
Decoding the S&P 500’s Critical Warning Sign
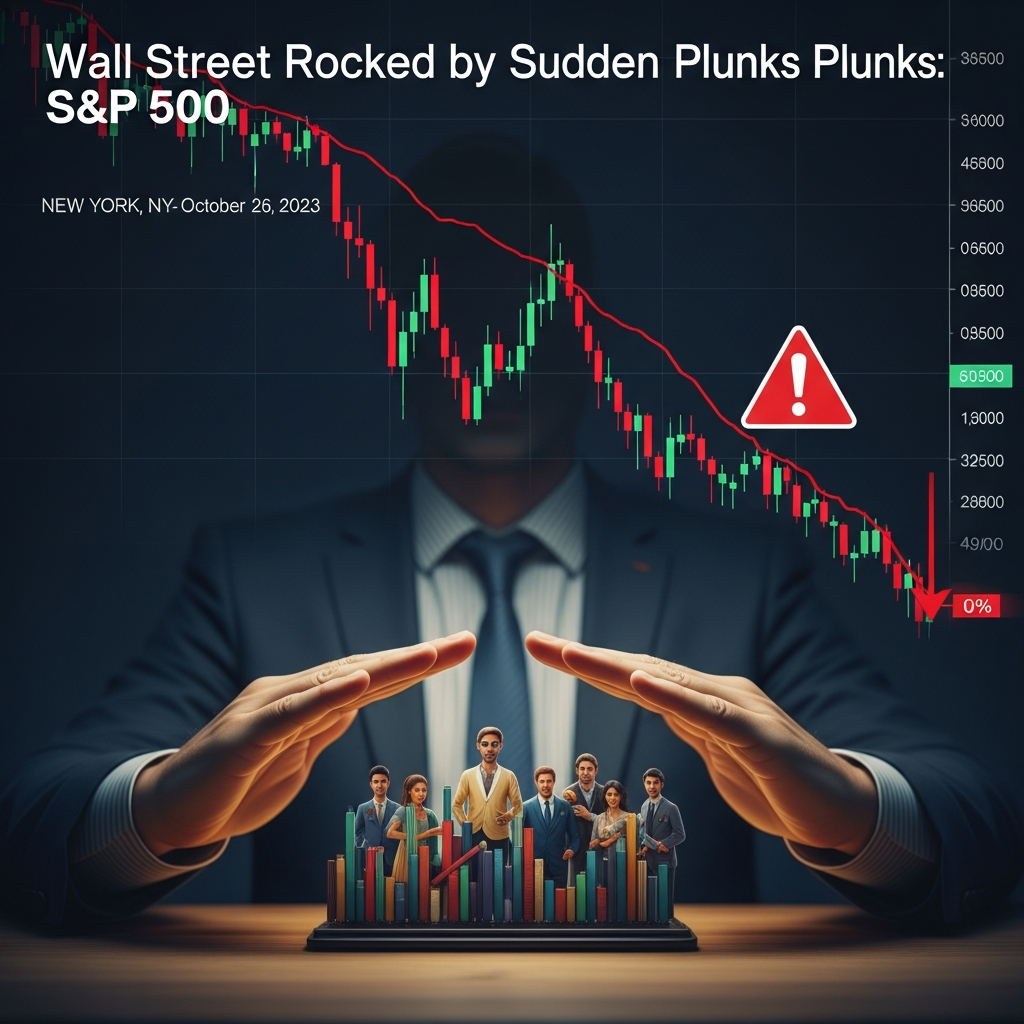
Market strategists are eyeing a crucial technical event. The S&P 500 recently dipped below its 200-day moving average. This move often precedes periods of market turbulence. While not a guaranteed predictor, it serves as a powerful historical indicator. Historically, this cross has signaled a challenging environment. It warns of a potential market downturn in the coming months.
The 200-day moving average is a key technical line. It represents the average closing price over the past 200 trading days. When an index falls below this line, it suggests a shift. It moves from an uptrend to a potential downtrend. This historical correlation makes it a closely watched metric.
Historical Context of Market Declines
Lance Roberts, Chief Investment Strategist at RIA Advisors, highlights this pattern. His analysis shows similar crosses at the start of every bear market since 2000. Following these events, the S&P 500 saw an average drop. It typically ended 4.8% lower six months after the initial breach. This historical data underscores the signal’s importance. It provides a tangible basis for investor concern.
Current market struggles contribute to this sentiment. Surging oil prices strain consumer budgets. A weak jobs report fuels economic uncertainty. Persistent inflation erodes purchasing power. Even the rapid evolution of AI brings market disruption. These factors collectively dampen investor optimism.
Key Indicators to Monitor for Market Health
While fundamental factors are vital, technical indicators offer real-time clues. Roberts, a respected voice in financial analysis, outlined six specific criteria. These indicators help assess the market’s underlying health. Investors should keep a close watch on them.
Roberts’ Six-Point Market Health Checklist:
- Downward Trend in S&P 500 200-Day Moving Average: The average itself should be falling. This indicates sustained selling pressure. It confirms a longer-term bearish trend.
- MACD Entering Negative Territory: The Moving Average Convergence/Divergence indicator measures momentum. A dip into negative territory signals increasing bearish momentum. It shows selling pressure is outweighing buying interest.
- Relative Strength Index (RSI) Below 32: The RSI gauges overbought or oversold conditions. A reading below 32 suggests the market is oversold. This can signal potential capitulation.
- AAII Sentiment Survey Shows Over 45% Bearish Investors: High bearish sentiment can sometimes precede a market bottom. However, extreme fear can also exacerbate declines.
- More Than 40% of S&P 500 Stocks Below Their 200-Day Moving Averages: This indicates widespread weakness. It shows the market decline isn’t confined to just a few stocks.
- 200-Day Moving Average Crosses Below the 50-Day Moving Average: This is known as a “death cross.” It is a strong bearish signal. It implies a significant shift in market trend.
As of Roberts’ recent report, only two of these six conditions are currently active. Forty-six percent of S&P 500 stocks trade below their 200-day moving averages. Additionally, the MACD indicator is still trending downwards. This mixed signal suggests caution, but not necessarily panic. It highlights the market’s uncertain state. It is too early to predict the market’s ultimate direction. However, preparing your portfolio for potential near-term downside remains prudent.
Six Essential Steps for Portfolio Protection
Preparing your portfolio means mitigating risk. It involves strategic adjustments, not rash decisions. Roberts suggests several proactive measures. These steps aim to “take risk off the table.” They can help limit potential losses in a volatile environment.
1. Trim Your Largest Positions
Review your portfolio’s most concentrated holdings. These are often your highest-valuation, highest-conviction stocks. Consider reducing these positions by 20% to 30%. This isn’t a bet against future recovery. Instead, it limits damage from further drawdowns. It creates a more balanced risk profile.
2. Increase Your Cash Holdings
Aim to hold at least 10% to 15% of your portfolio in cash. Cash provides critical liquidity. It acts as a buffer during market declines. More importantly, it offers “dry powder.” This allows you to seize opportunities when asset prices fall. You can then buy quality assets at discounted valuations.
3. Prioritize “Quality” Stocks Over “Growth”
Shift your focus towards quality factor investments. These stocks typically have strong fundamentals. Look for companies with pricing power. They should possess robust balance sheets. High free cash flow levels are also a positive sign. These characteristics make them more resilient in downturns. Growth stocks, while exciting, often face greater pressure during bear markets. The Vanguard U.S. Quality Factor ETF (VFQY) is one example of a fund targeting such companies.
4. Increase Allocation to Defensive Sectors
Certain sectors tend to perform better during market turbulence. Increase your exposure to utilities, healthcare, and consumer staples. These are considered defensive sectors. Demand for their products and services remains relatively stable. People still need electricity, medicine, and food, regardless of economic conditions. This stability provides a defensive buffer.
5. Tighten Stop-Losses for Volatile Holdings
For more volatile stocks, like cyclicals, adjust your stop-loss orders. Cyclical stocks are highly sensitive to economic cycles. Set stop-losses to limit downside to 7% to 10%. This strategy helps protect capital. It prevents small corrections from becoming significant losses. It provides a disciplined exit strategy.
6. Extend Treasury Exposure Duration
Consider moving up the average duration of your Treasury bond holdings. Aim for the five-to-seven year range. Longer-duration bonds often offer higher yields. They also tend to increase in value when economic growth falters. This provides a counter-balance to declining stock values. It enhances overall portfolio diversification.
Beyond Technicals: A Holistic View of Market Health
While technical signals are valuable, a comprehensive approach is best. Understanding the broader economic landscape is crucial. Factors like global oil prices, employment data, and inflation trends all play a role. These fundamental drivers influence market sentiment. They shape corporate earnings and investor behavior.
Artificial intelligence (AI) disruption is another evolving factor. Its impact on various industries is still unfolding. Investors must remain adaptable. Avoid making emotional, impulsive decisions. Market corrections are a natural part of the investing cycle. They can be unsettling, but also create future opportunities. A well-diversified, strategically managed portfolio is your best defense.
Frequently Asked Questions
What does the S&P 500 dipping below its 200-day moving average signify?
This specific technical event is a crucial “warning signal” for investors. It suggests a potential shift from an uptrend to a downtrend in the broader market. Historically, as noted by Lance Roberts of RIA Advisors, this signal has appeared at the beginning of every bear market since 2000, with the S&P 500 averaging a 4.8% decline six months post-cross. While not a guarantee, it indicates increased risk and the need for portfolio preparation due to potential downside ahead.
What are Lance Roberts’ key technical indicators to monitor for market health?
Lance Roberts recommends tracking six specific technical indicators. These include the S&P 500 200-day moving average trending downward, the MACD indicator dipping into negative territory, the Relative Strength Index (RSI) falling below 32, the American Association of Individual Investors’ sentiment survey showing over 45% bearish investors, more than 40% of S&P 500 stocks trading below their 200-day moving averages, and the 200-day moving average crossing below the 50-day moving average. These provide a comprehensive picture of market momentum and investor sentiment.
How can investors immediately adjust their portfolios to mitigate a potential market downturn?
Investors can take several immediate steps to protect their portfolios. These include trimming concentration in high-valuation positions by 20-30% to limit potential damage. Increasing cash holdings to 10-15% provides liquidity and dry powder for future buying. Shifting towards quality factor stocks and increasing allocation to defensive sectors like utilities, healthcare, and consumer staples offers stability. For volatile stocks, tightening stop-losses to 7-10% can prevent significant losses. Finally, extending the duration of Treasury bond exposure to the five-to-seven year range can provide higher yields and increase value during economic slowdowns.
Navigating Uncertainty with a Clear Strategy
The S&P 500’s recent signal serves as a potent reminder. Market dynamics are ever-changing. Proactive preparation is key to navigating periods of uncertainty. By understanding technical warnings and implementing expert-backed strategies, you can bolster your portfolio. Review your current holdings. Implement the suggested adjustments. Stay informed on both technical and fundamental market drivers. This approach helps protect your investments. It also positions you for future opportunities. Always consider consulting a qualified financial advisor for personalized guidance.